

Ripple’s price has been consolidating in a wide range over the recent month against both USDT and BTC. Yet, the future direction of the market might soon be revealed.
By Edris Derakhshi (TradingRage)
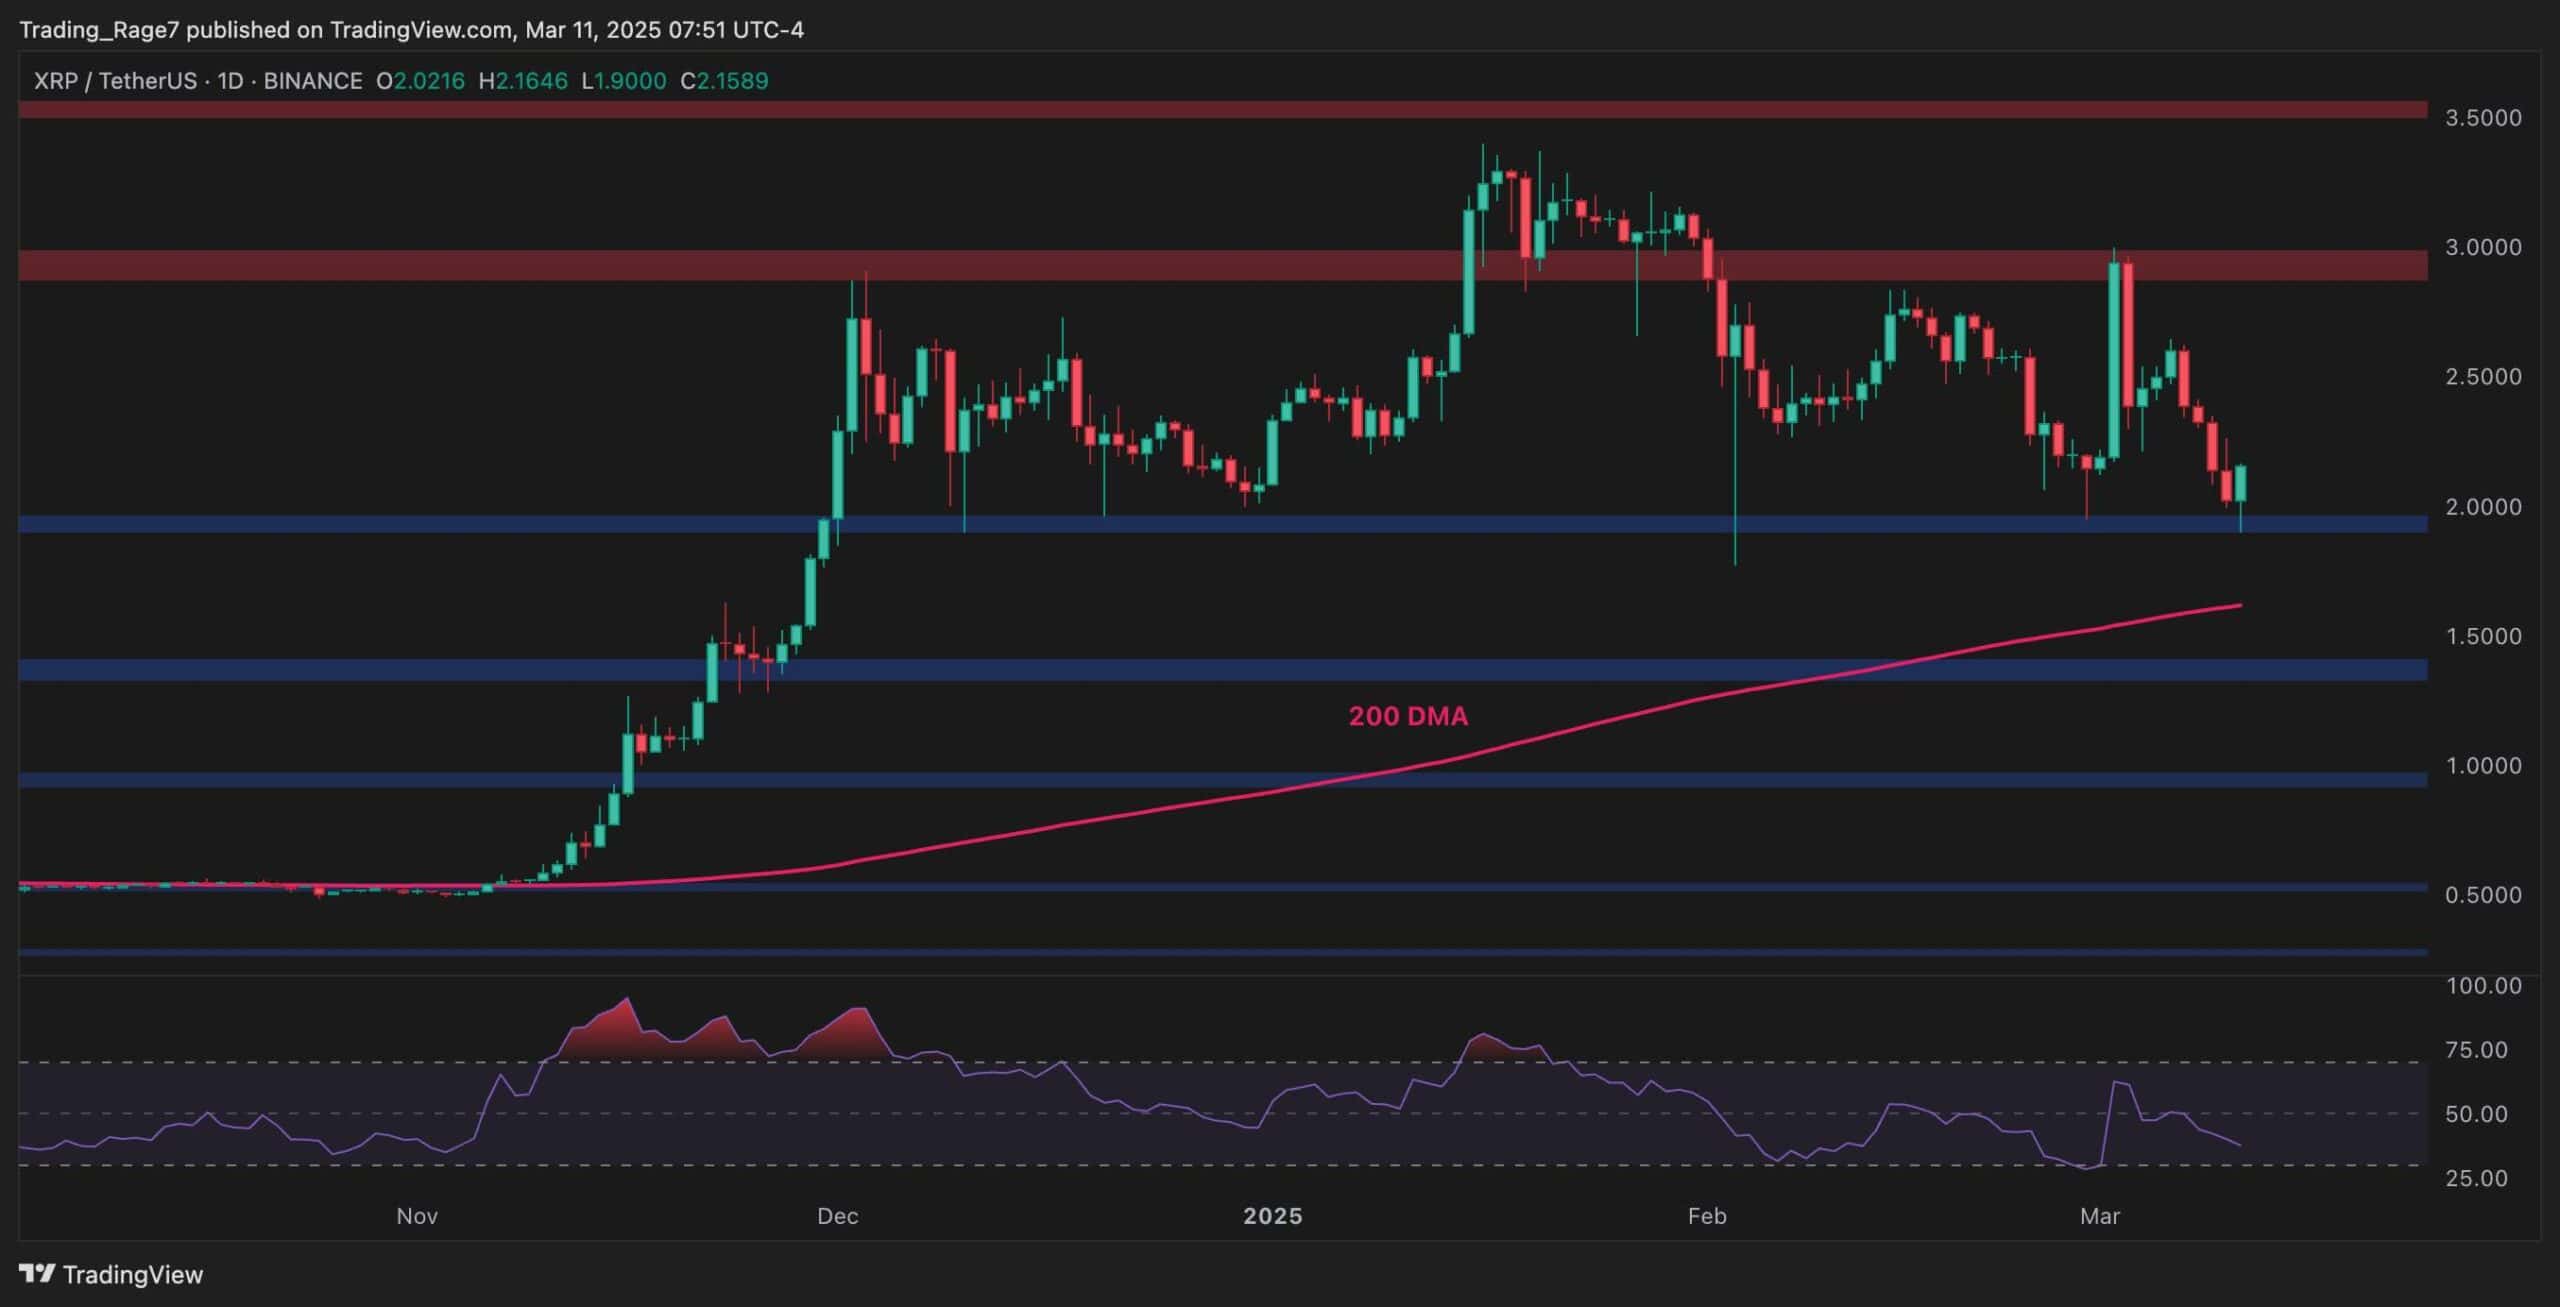
The USDT Paired Chart
XRP has been in a corrective downtrend after reaching a local high above $3.00 last week, with the price now testing the $2.00 psychological support.
The 200-day moving average remains far below the current price near $1.70, indicating that the long-term uptrend is still intact despite short-term weakness.
If $2.00 holds as support, XRP could attempt a recovery toward $2.50-$2.60, while a stronger rebound could lead to a revisit of the $3.00 resistance zone. However, a break below $2.00 would expose the 200-day moving average as the next target.
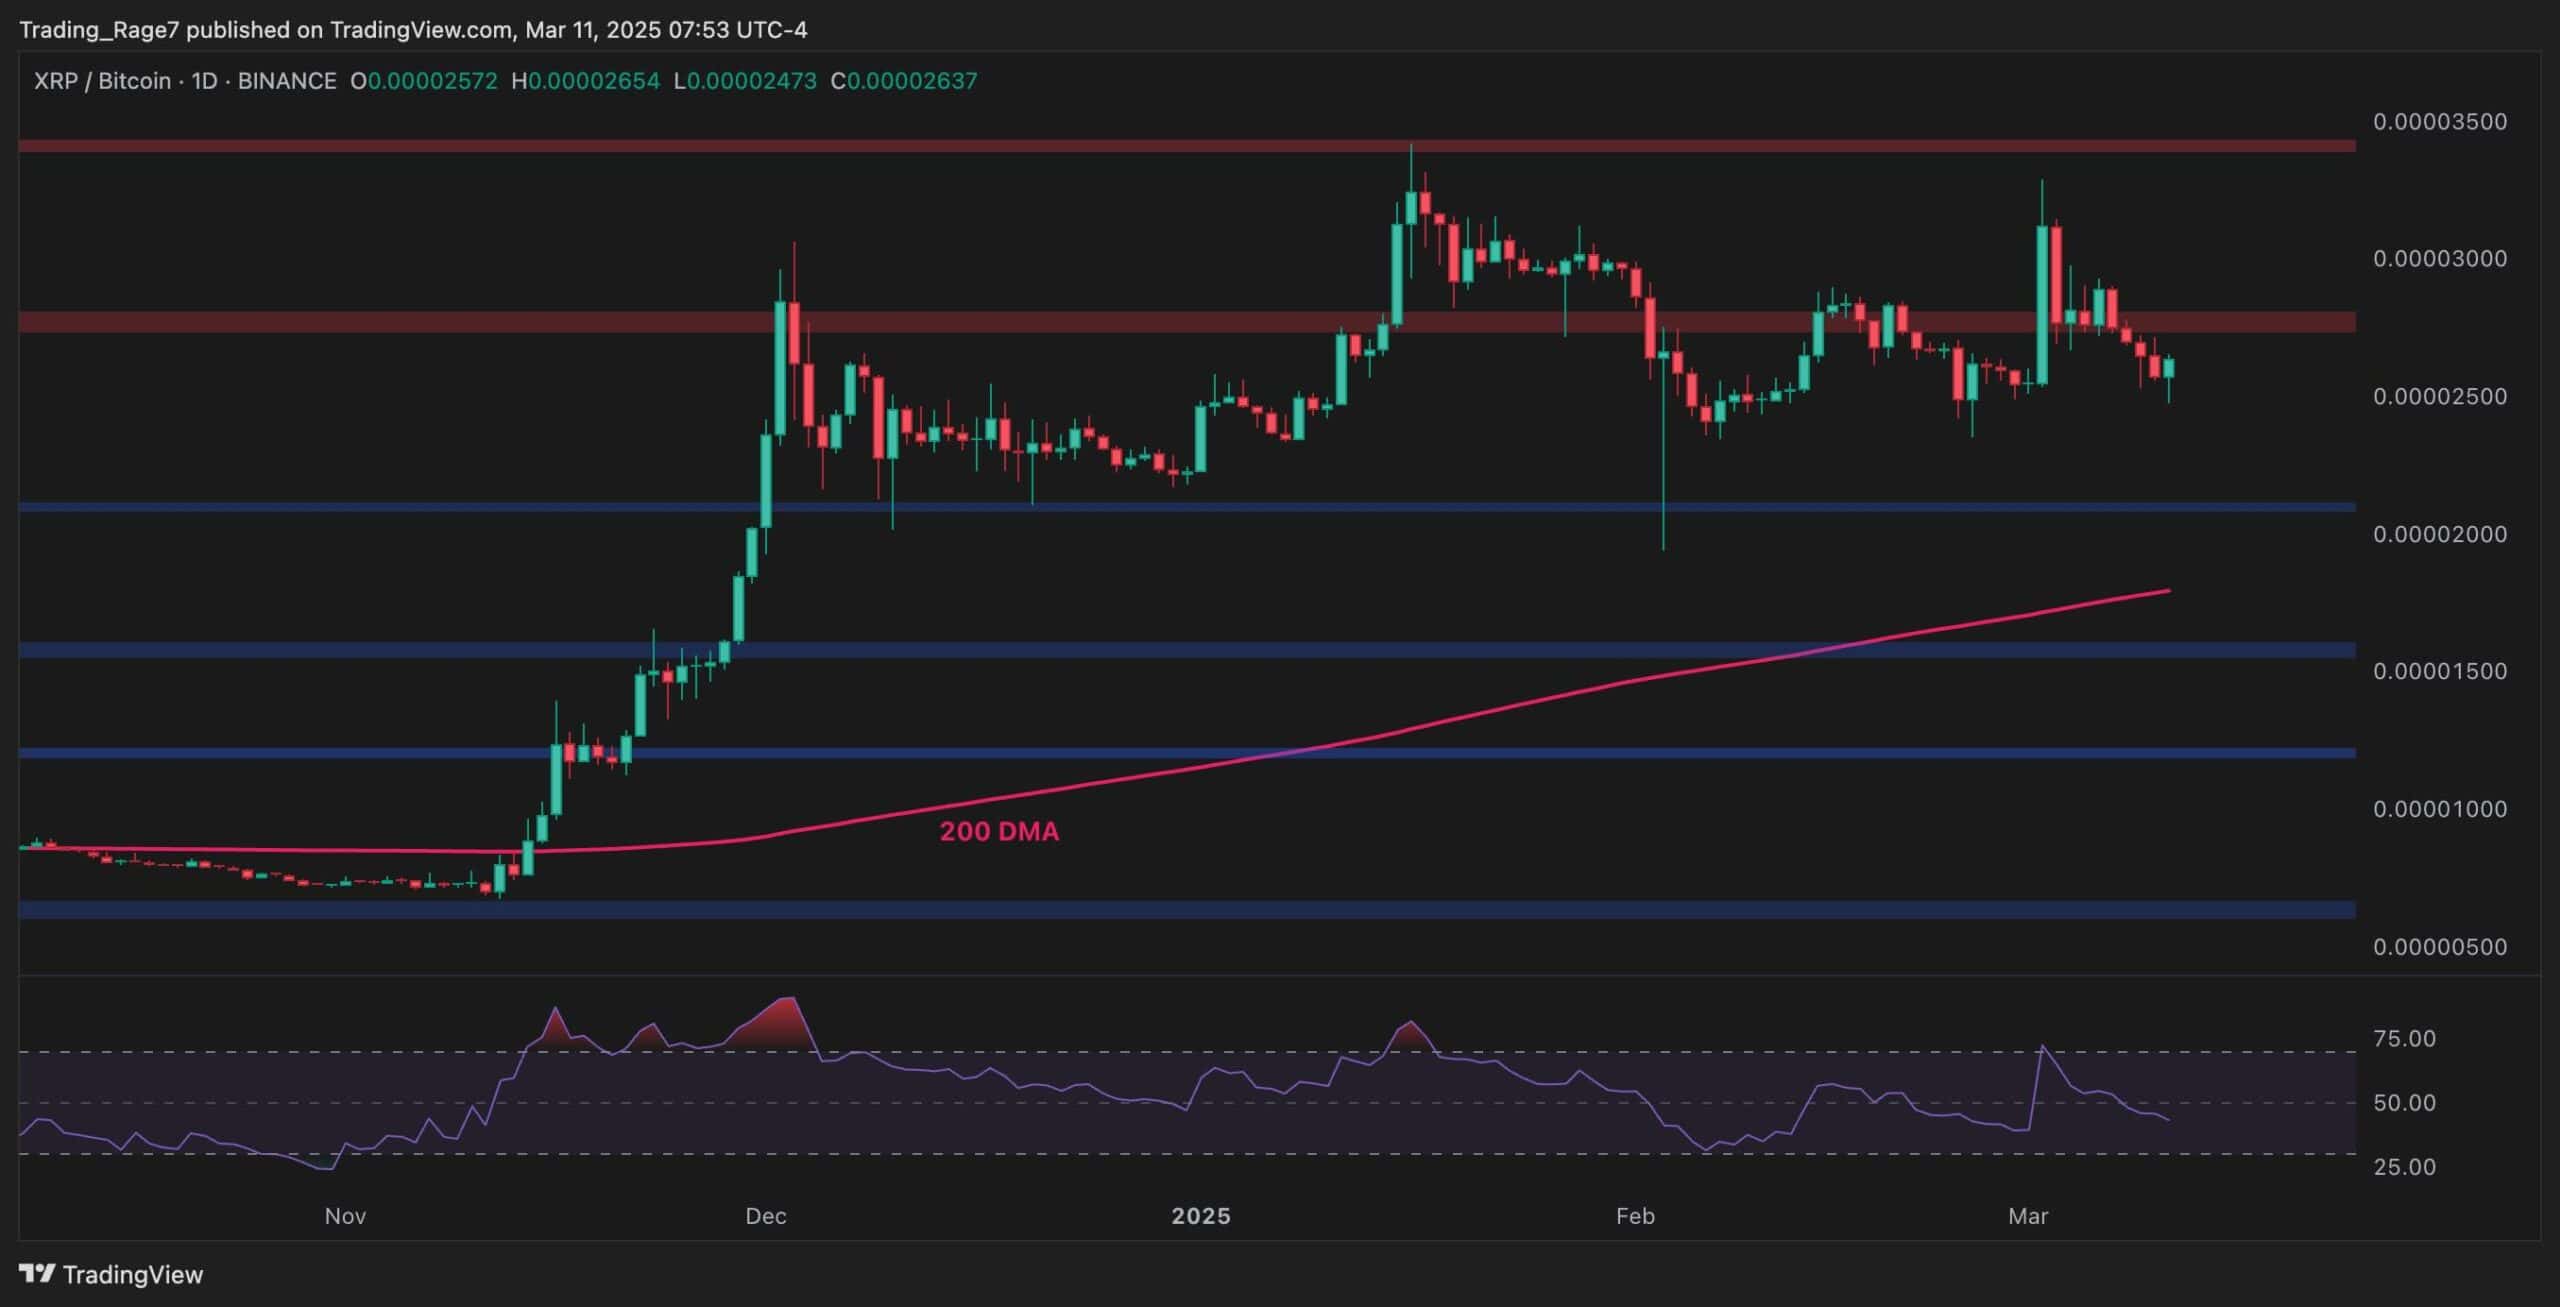
The BTC Paired Chart
The XRP/BTC ratio has been consolidating after a strong rally in November last year, with the price currently trading around 2,500 SAT.
The pair has faced resistance near 3,000 SAT, which has led to the recent pullback. The 200-day moving average at approximately 1,700 SAT remains intact, indicating that, similar to the USDT pair, the broader uptrend is still in play.
Yet, the RSI is trending lower, suggesting a potential weakening of momentum, but as long as XRP holds above 2,000 SAT, a bullish continuation above the 3,000 SAT area could be expected.
The post Ripple Price Analysis: Is XRP in Danger of Falling to $1.70 Soon? appeared first on CryptoPotato.


