

Bitcoin
.cwp-coin-chart svg path {
stroke-width: 0.65 !important;
}
Price
Volume in 24h
<!–
?
–>
Price 7d
continues to captivate investors with its dynamic price movements and market influence. In this detailed Bitcoin price analysis, we explore the latest trends, critical support and resistance levels, and technical indicators shaping BTC’s trajectory in 2025. Whether you’re a seasoned trader or a crypto enthusiast, this guide offers actionable insights to navigate the volatile cryptocurrency market. Stay informed and make data-driven decisions with our expert breakdown.
$BTC Price hovered around the same price during the weekend, opened up where it started and didn’t create a gap.
After futures opened it didn’t take long for $BTC and $GOLD to move up quickly as equities moved down.
Pretty interesting move which is now compounding on the… https://t.co/nWsZylmYoW pic.twitter.com/lL5jz3VLov
— Daan Crypto Trades (@DaanCrypto) April 21, 2025
Daan has caught something really important. Such a strong start right off the bat after trading opened is a good signal! There is no CME gap down around $84,000, which is great because these gaps tend to get filled. Now that there isn’t one, it gets even more interesting.
Please catch up if you have not read the previous article here.
DISCOVER: Top 20 Crypto to Buy in April 2025
Bitcoin Price Analysis – Let’s Break It Down
(BTCUSD)
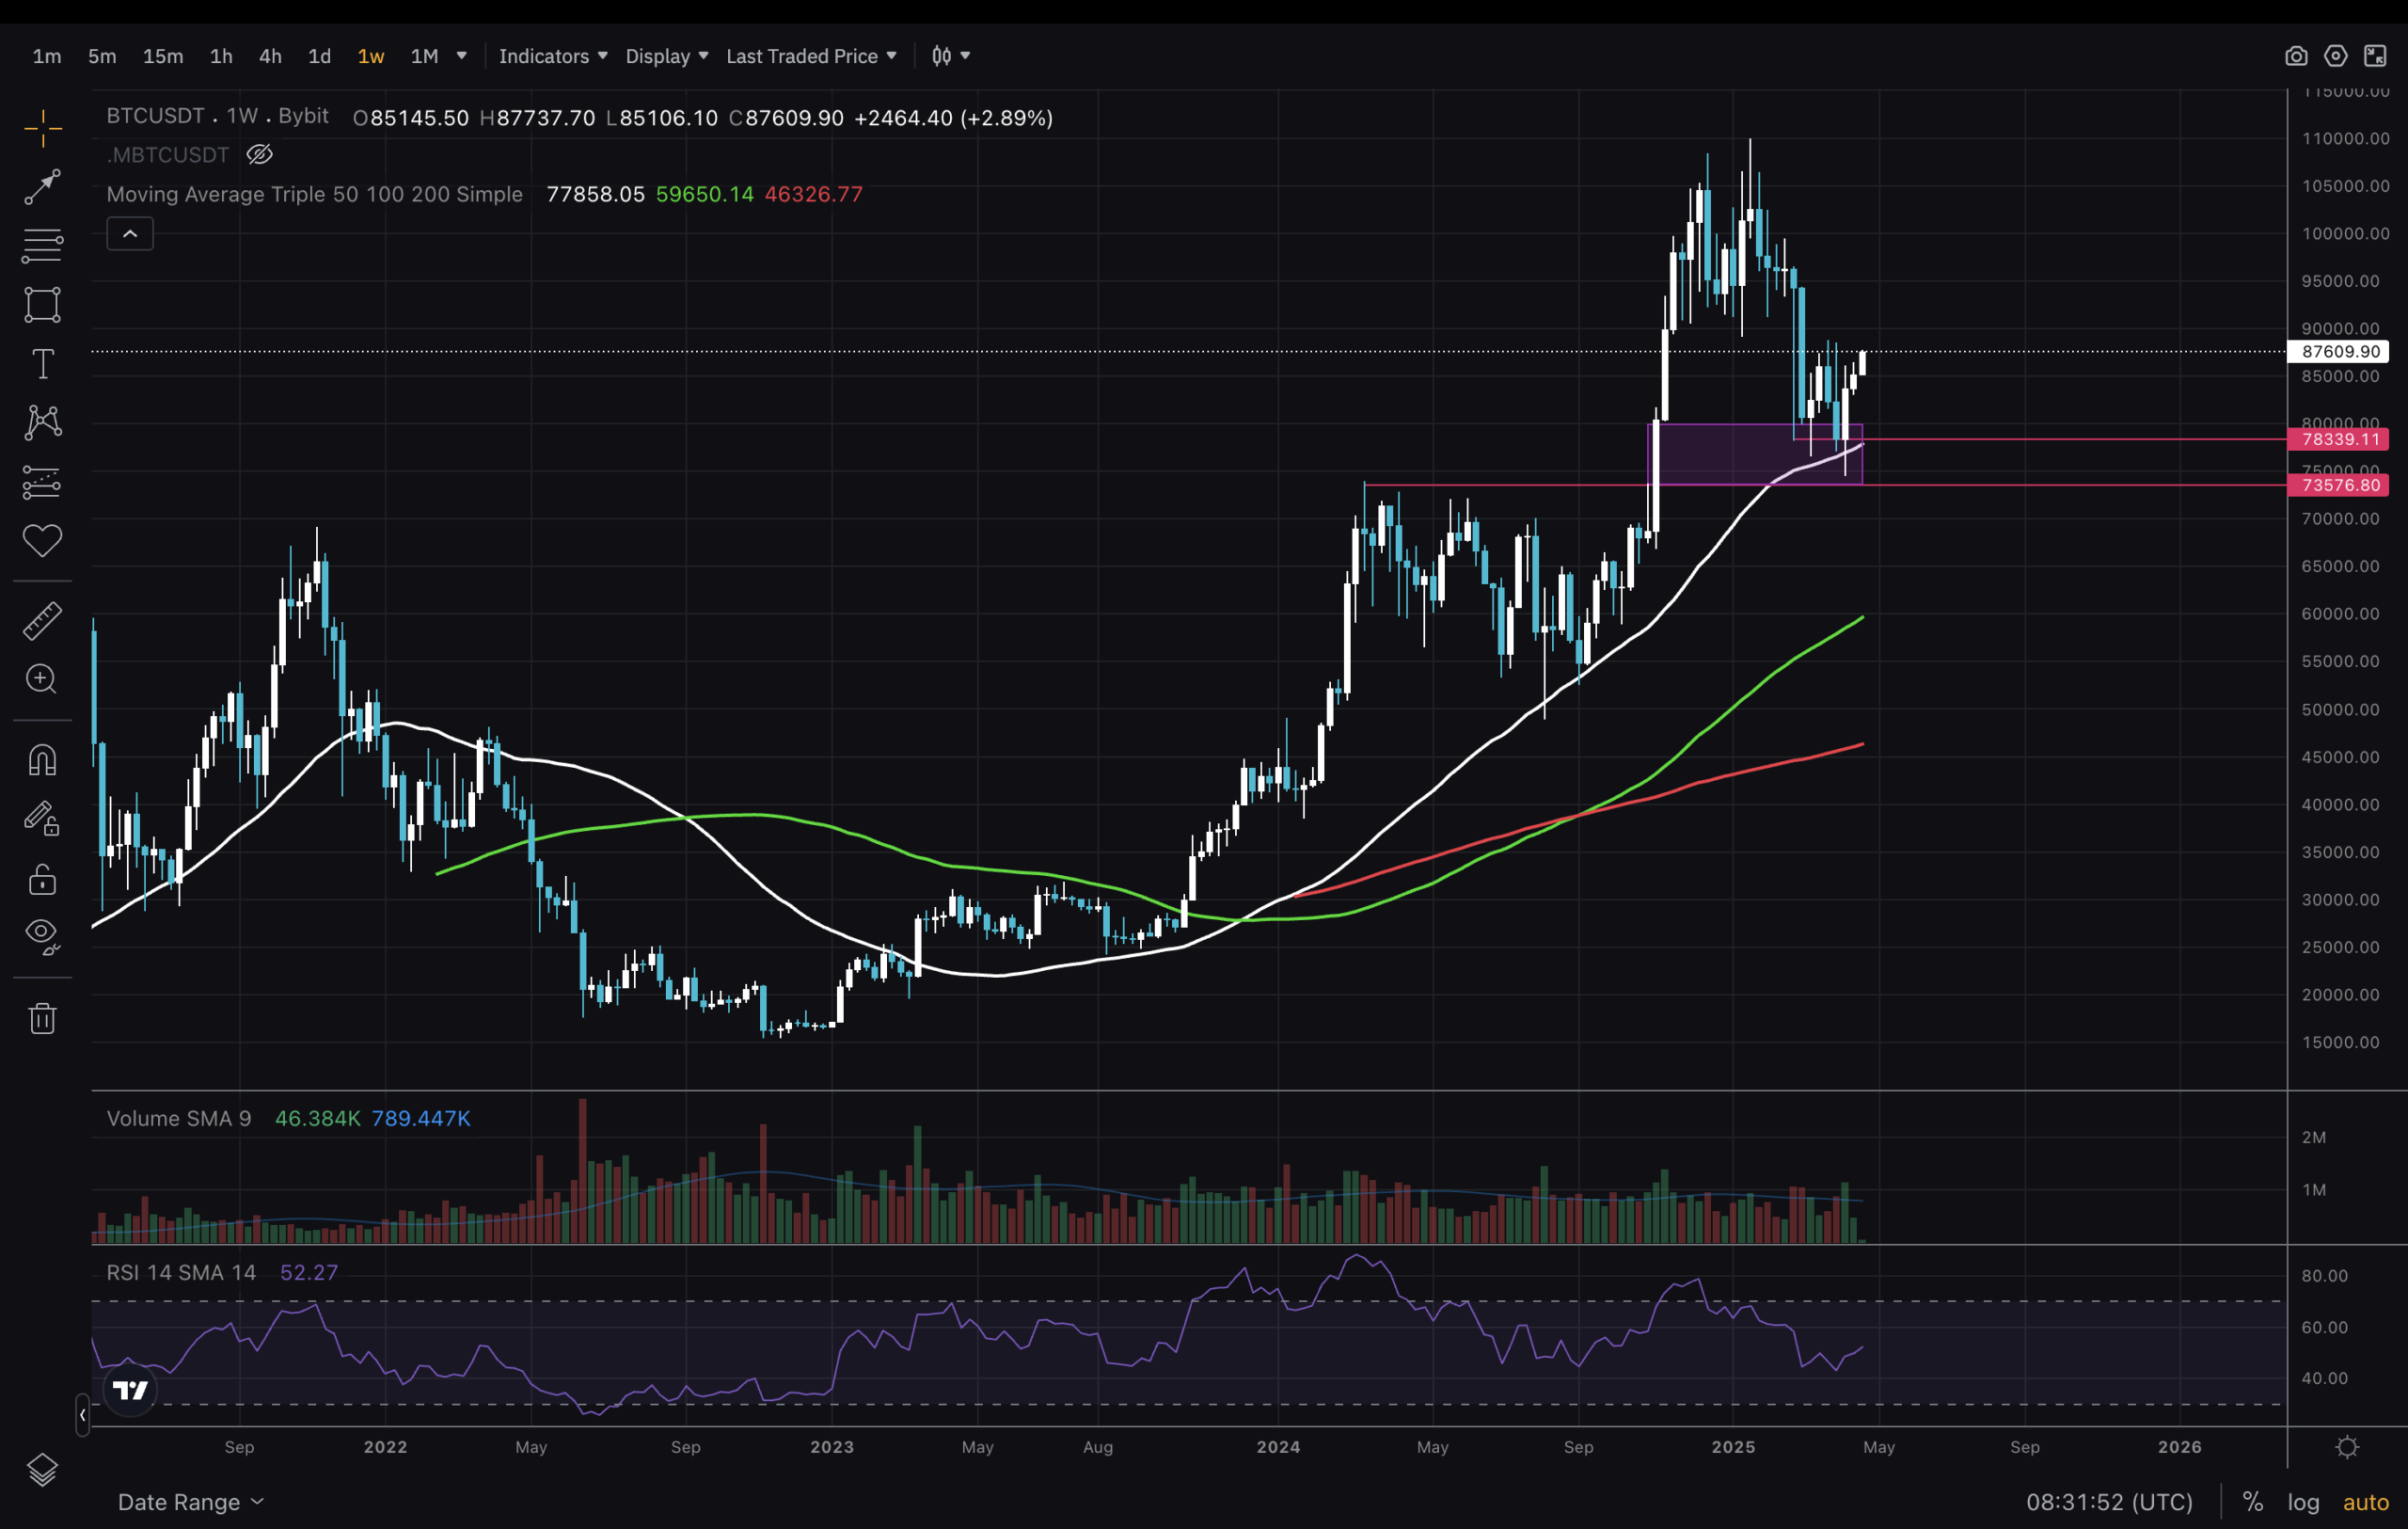
On the weekly timeframe, the MA50 acted as support, and price bounced off it two weeks ago. Will we see another touch like last year? The same candle that was wicked and closed above the MA50 formed an SFP at the $78,000 line. On this higher timeframe, we can see that the structure remains bullish.
(BTCUSD)
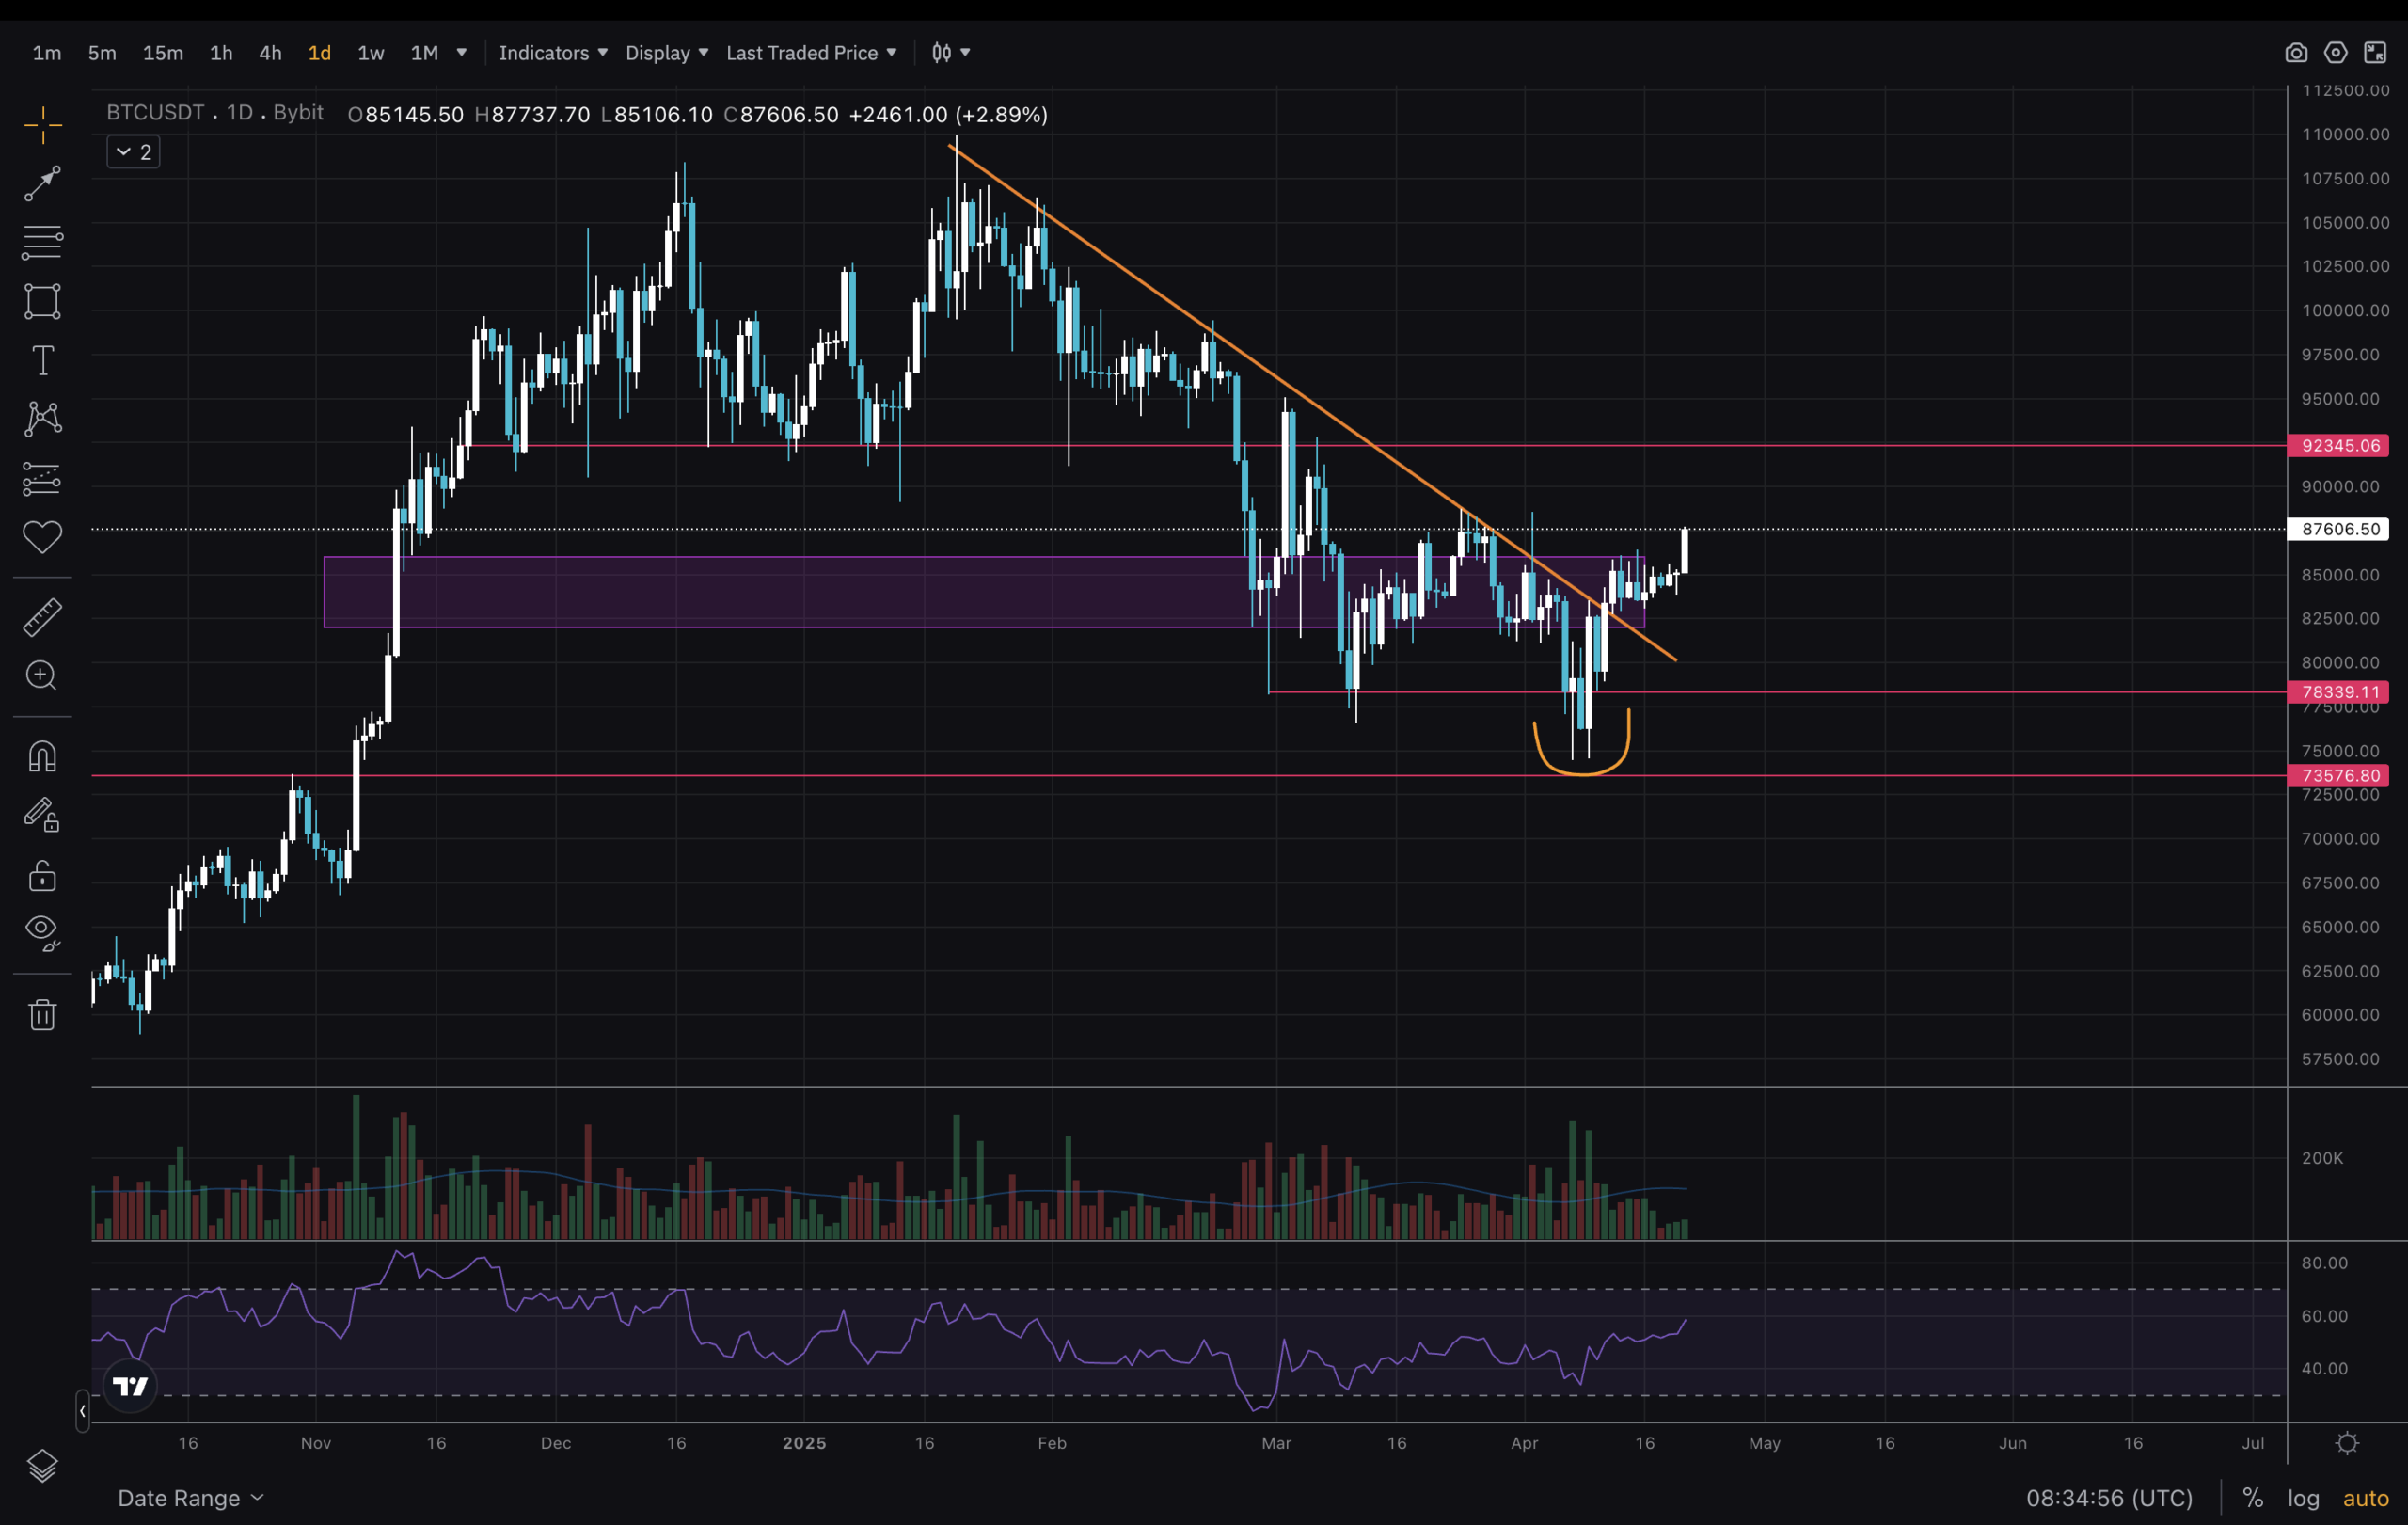
On the 1D timeframe, the chart starts the day very bullish. The pattern resembles Head and Shoulders, though it is not quite it as the shoulders are not clearly defined. Nevertheless, the initial trendline has been broken. My purple zone has been an area of interest, and price spent most of this dip in it, though it went below, too. I’ll address that in the next chart.
DISCOVER: Best Meme Coin ICOs to Invest in April 2025
1D RSIs and Lower Timeframe Trading Nuggets
(BTCUSD)
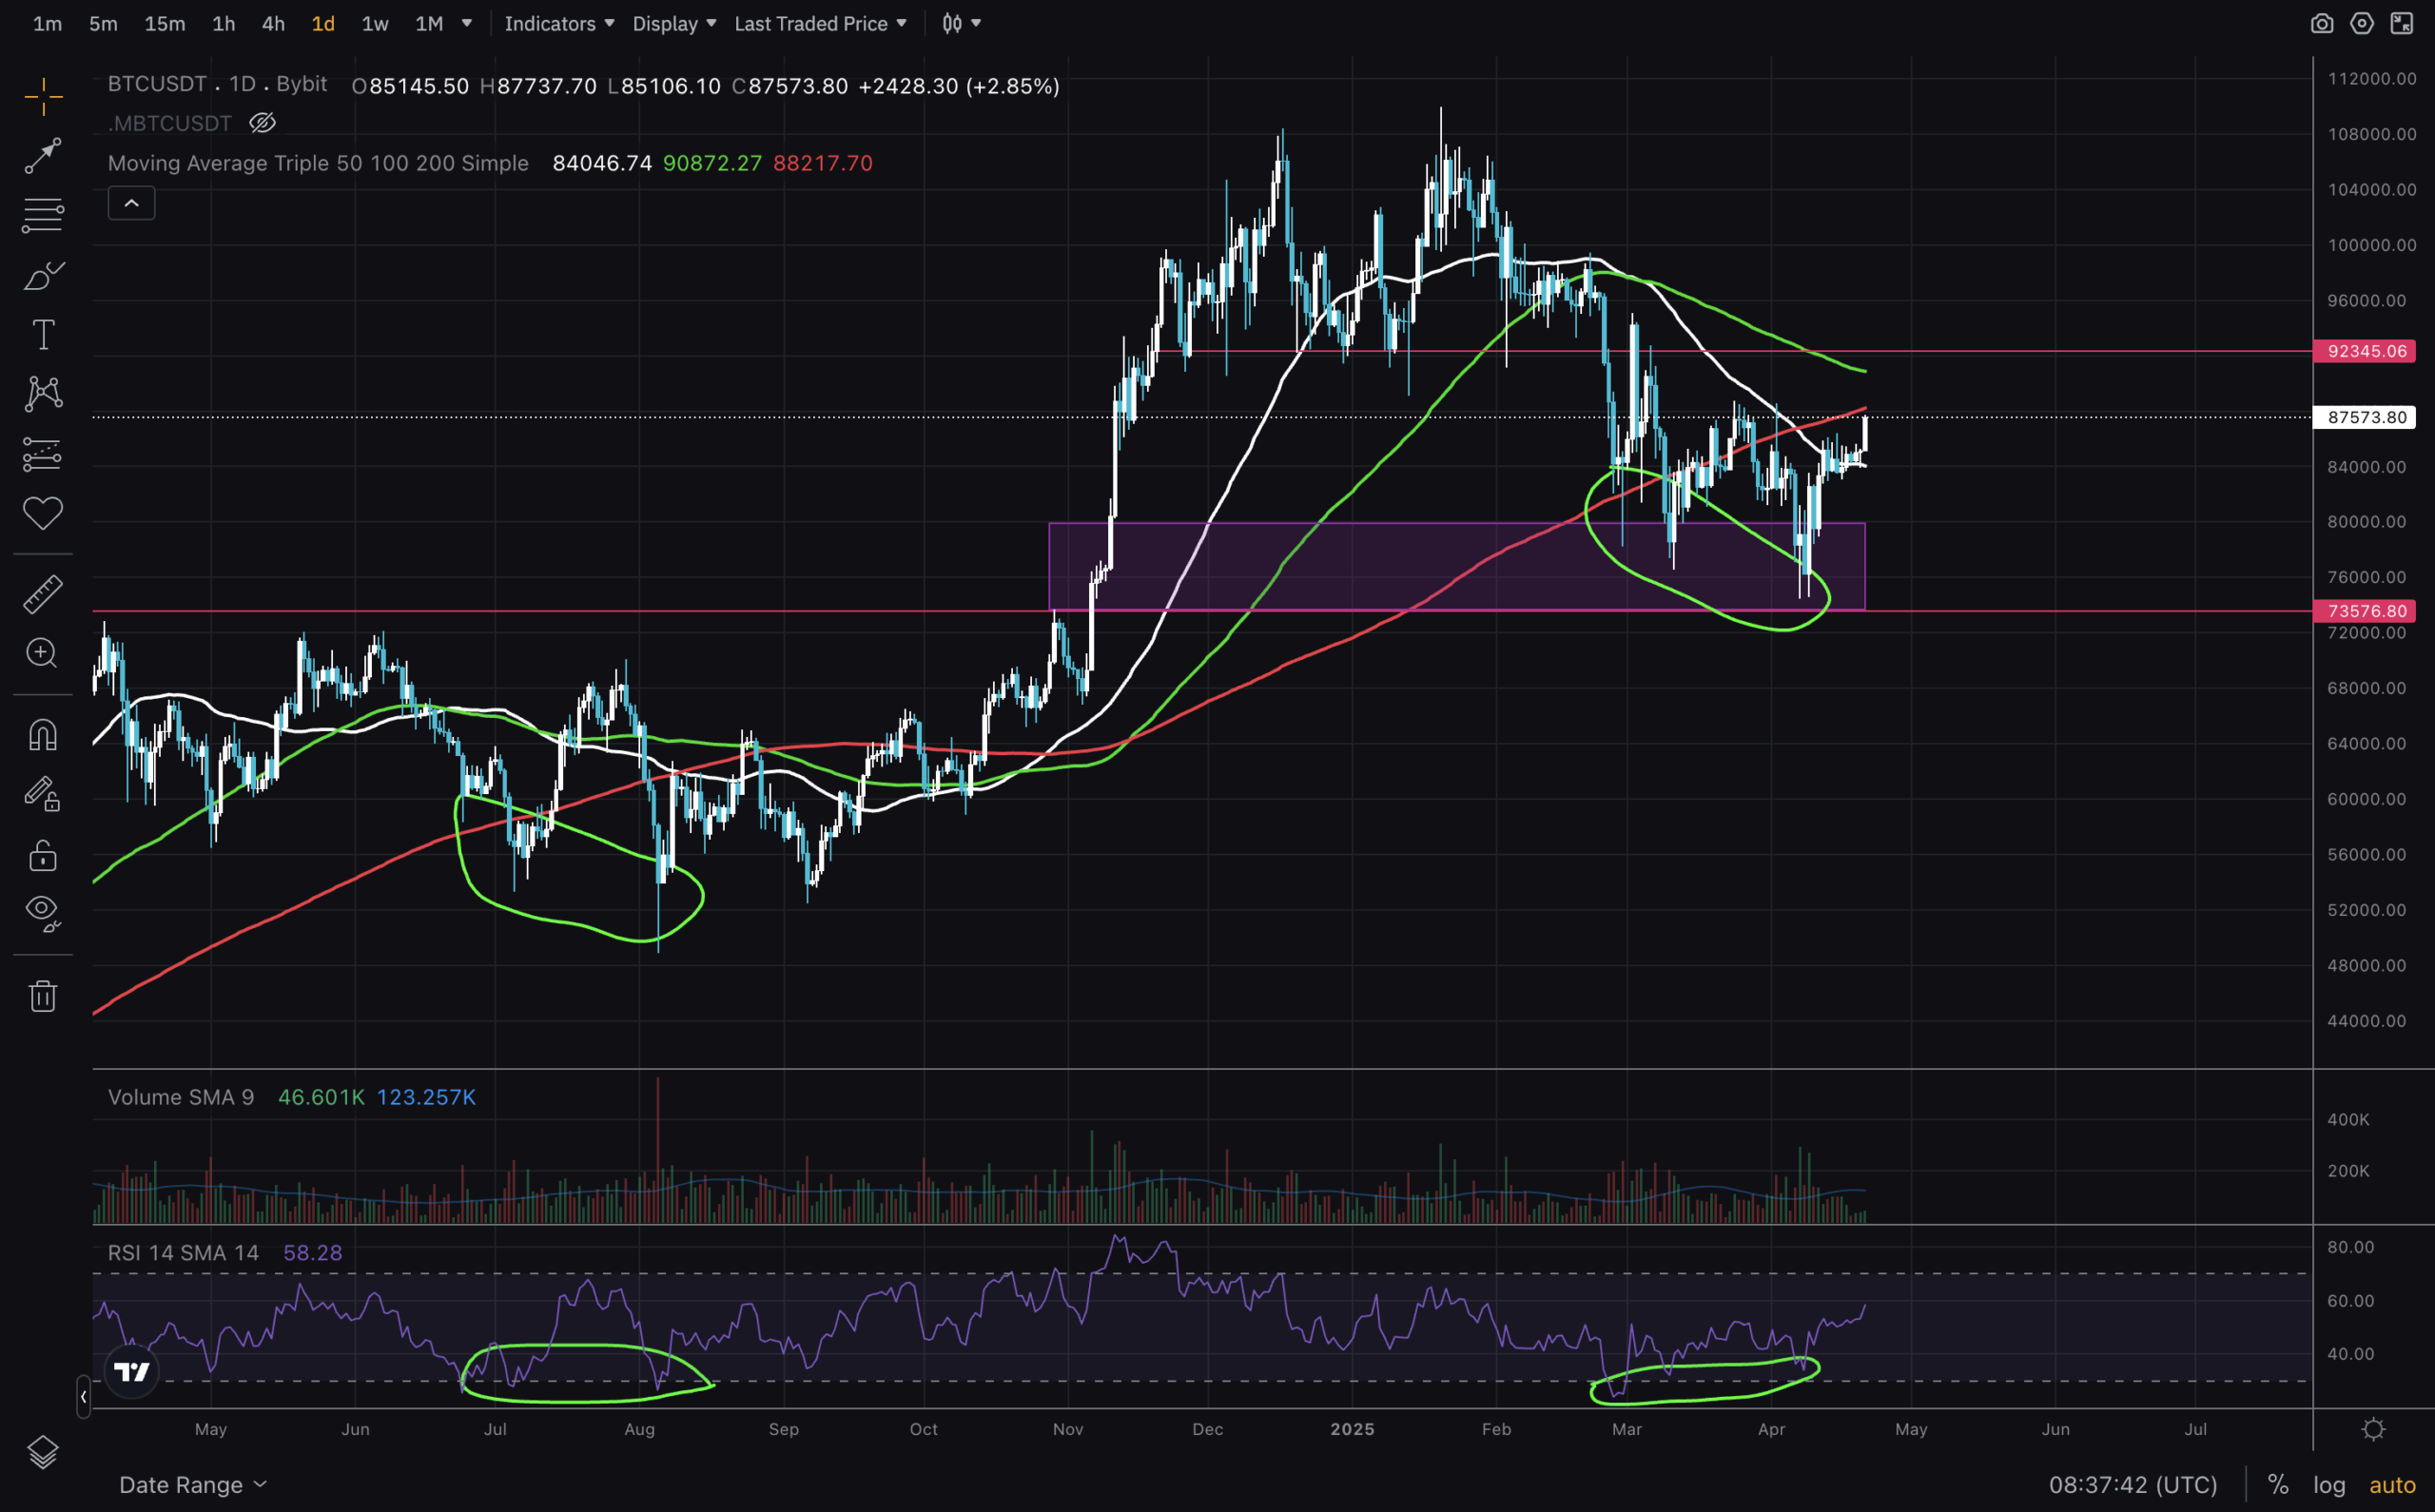
This 1D chart will focus on the RSI and moving averages. As we see, price has just reclaimed the MA50 and is very close to MA200, while MA100 is at the top. For a clear bullish structure, we want to see it go above all MAs. The RSI has formed a bullish divergence just like last year’s summer. About one month long. It took another two to three months for the price to break above and enter price discovery. How long will it range this time? As it is currently, I want to see it reclaim the $92,000 level.
(BTCUSD)
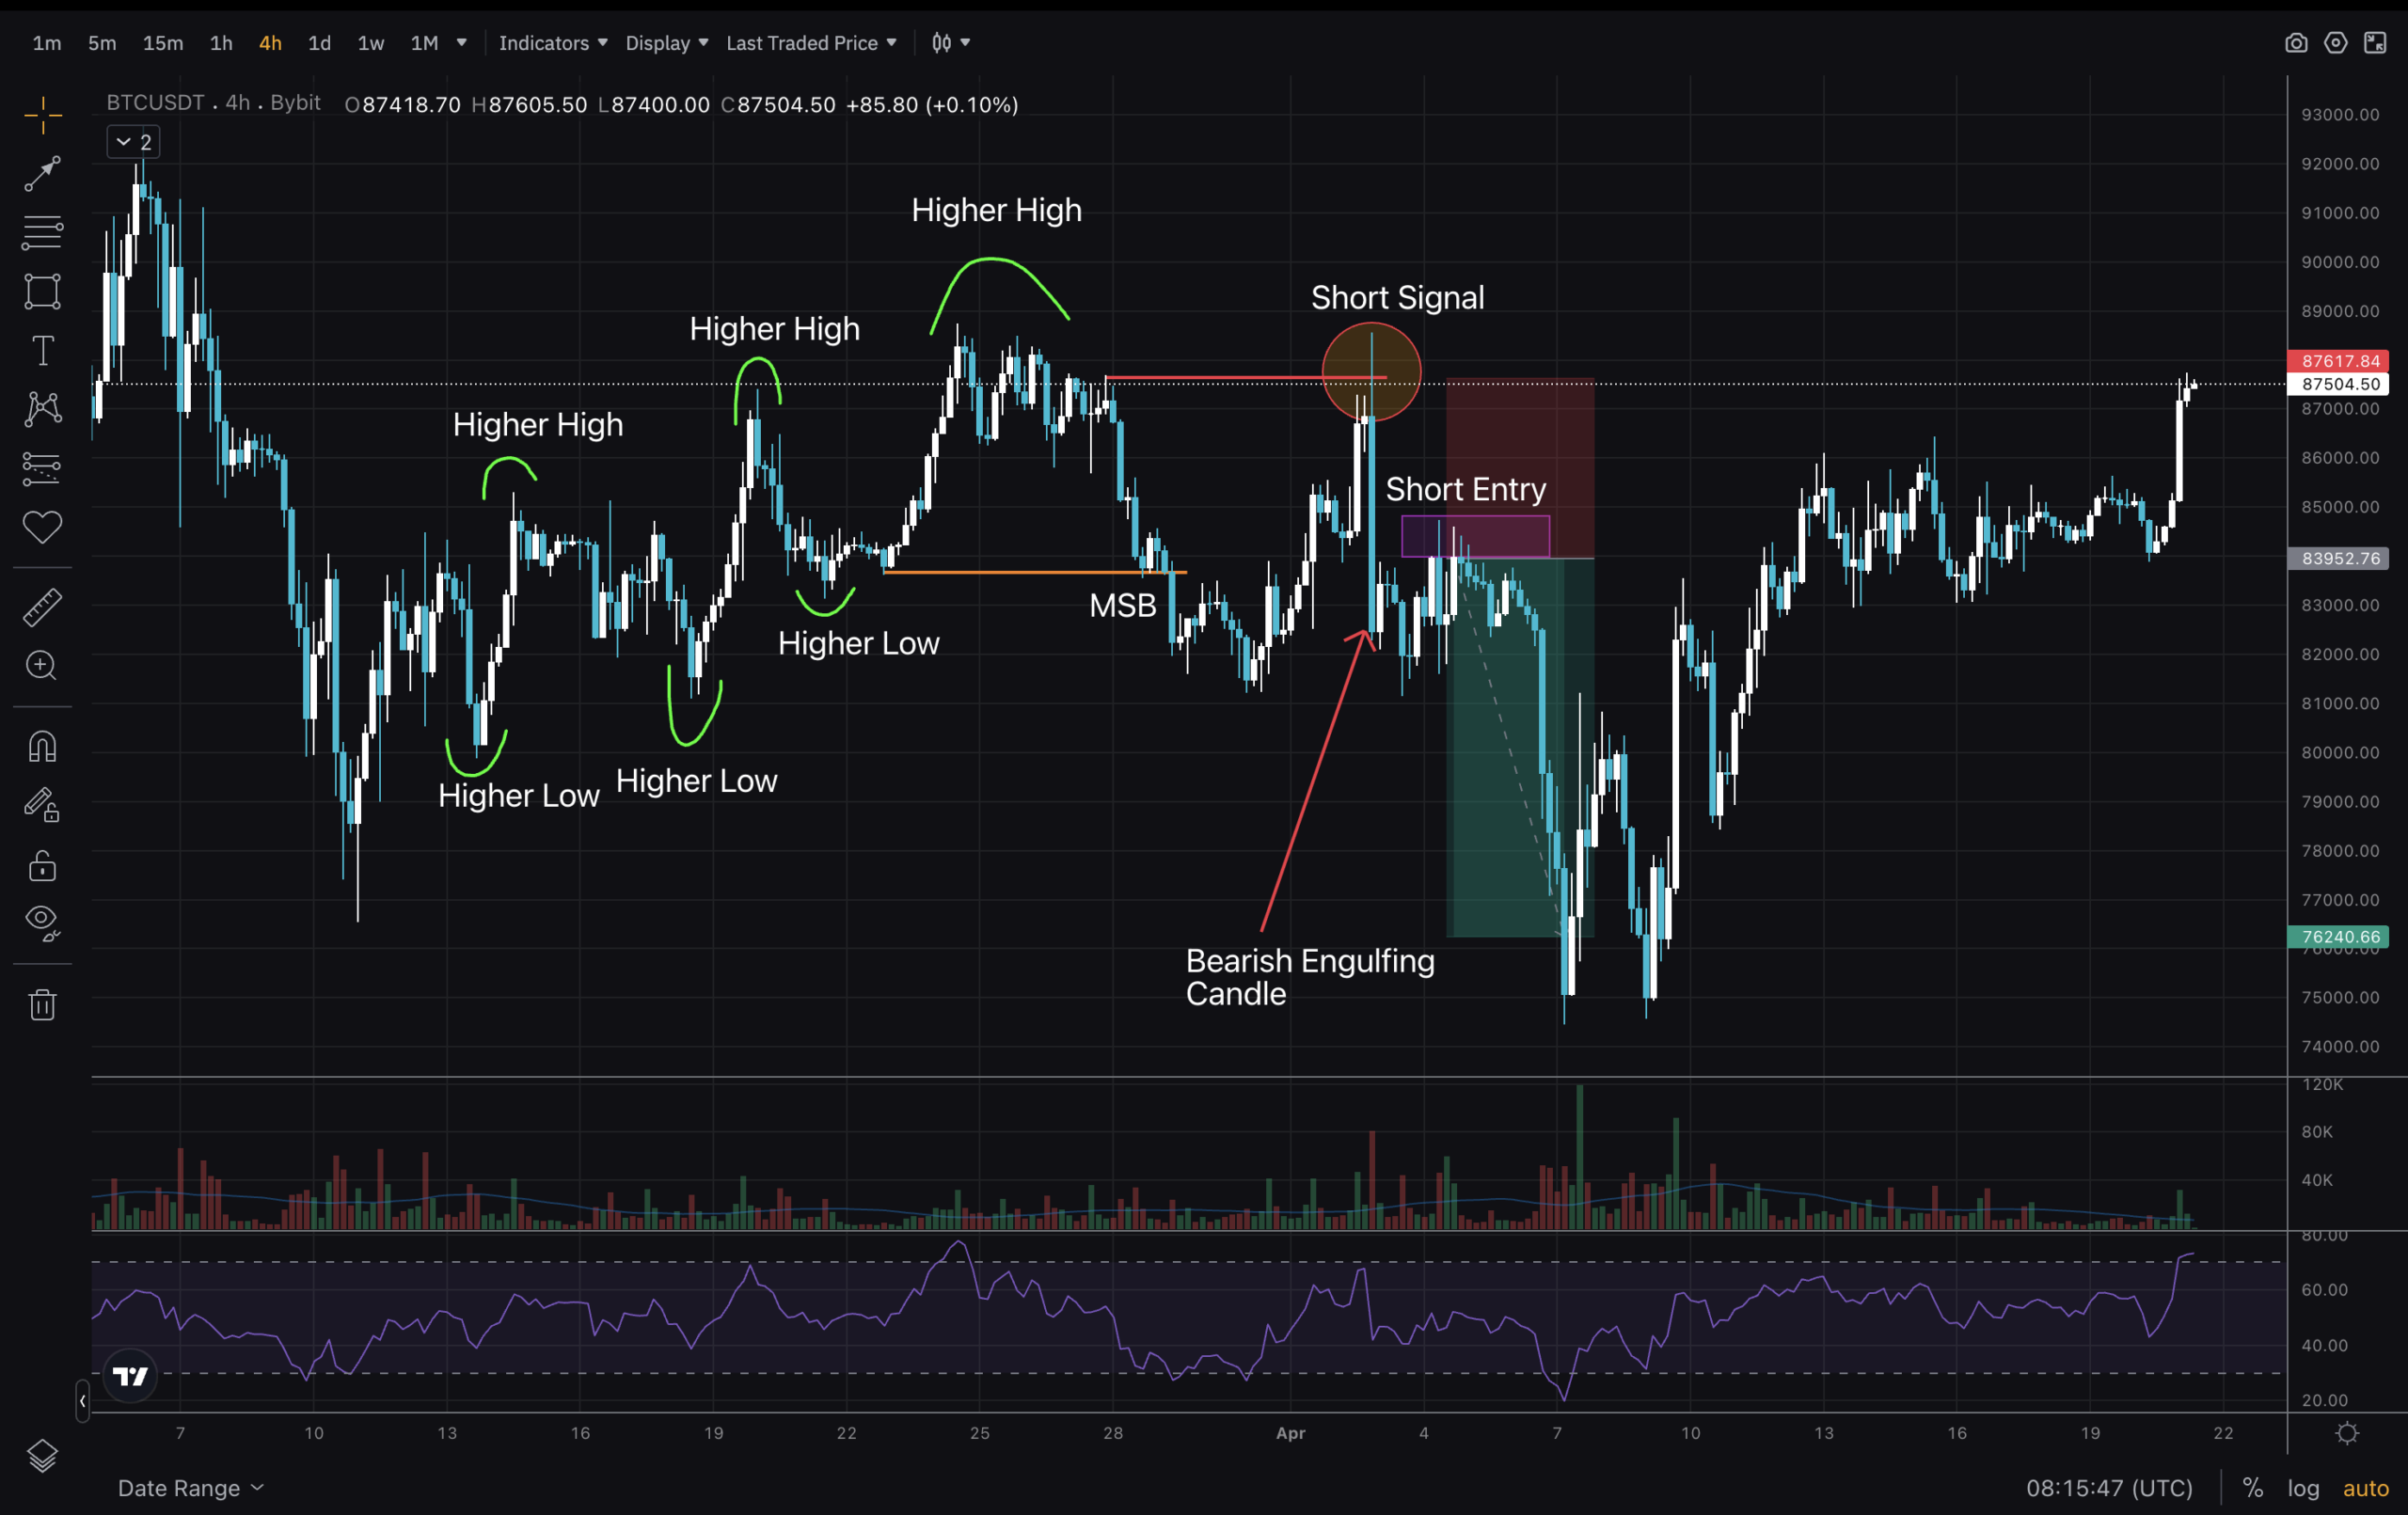
Here are some insights from the 4H—the higher high and higher low structure discussed in this past article—check it out. It broke, and if one were to watch it, they could’ve caught a good 2R short trade. When price bottomed at $75,000, it formed a bullish divergence, which provided another opportunity for a 2R long trade. Missing the entries can be hard sometimes, but stay away from FOMO!
DISCOVER: Best New Cryptocurrencies to Invest in 2025
Join The 99Bitcoins News Discord Here For The Latest Market Updates
Bitcoin Price Analysis: Key Trends and Areas to Watch
- Key levels to reclaim are $87,000 and then $92,000
- Long RSI bullish divergence on 1D
- A potential bottom is forming
The post BTC Targets $90K: Bitcoin Price Analysis – Key Levels To Watch Into May appeared first on 99Bitcoins.


