

Bitcoin has dipped below the 100-day moving average at $98K, approaching the key $95K support level.
However, low trading activity suggests a lack of strong momentum, making further short-term consolidation likely.
Technical Analysis
By Shayan
The Daily Chart
Bitcoin has recently dipped below the critical 100-day moving average at $98K, signaling a slight increase in selling pressure. However, the lack of strong bearish momentum suggests weak overall market participation, with neither buyers nor sellers displaying dominance.
Despite this, the breakdown introduces a bearish bias, increasing the likelihood of further consolidations and potential retracements toward the significant $90K support level.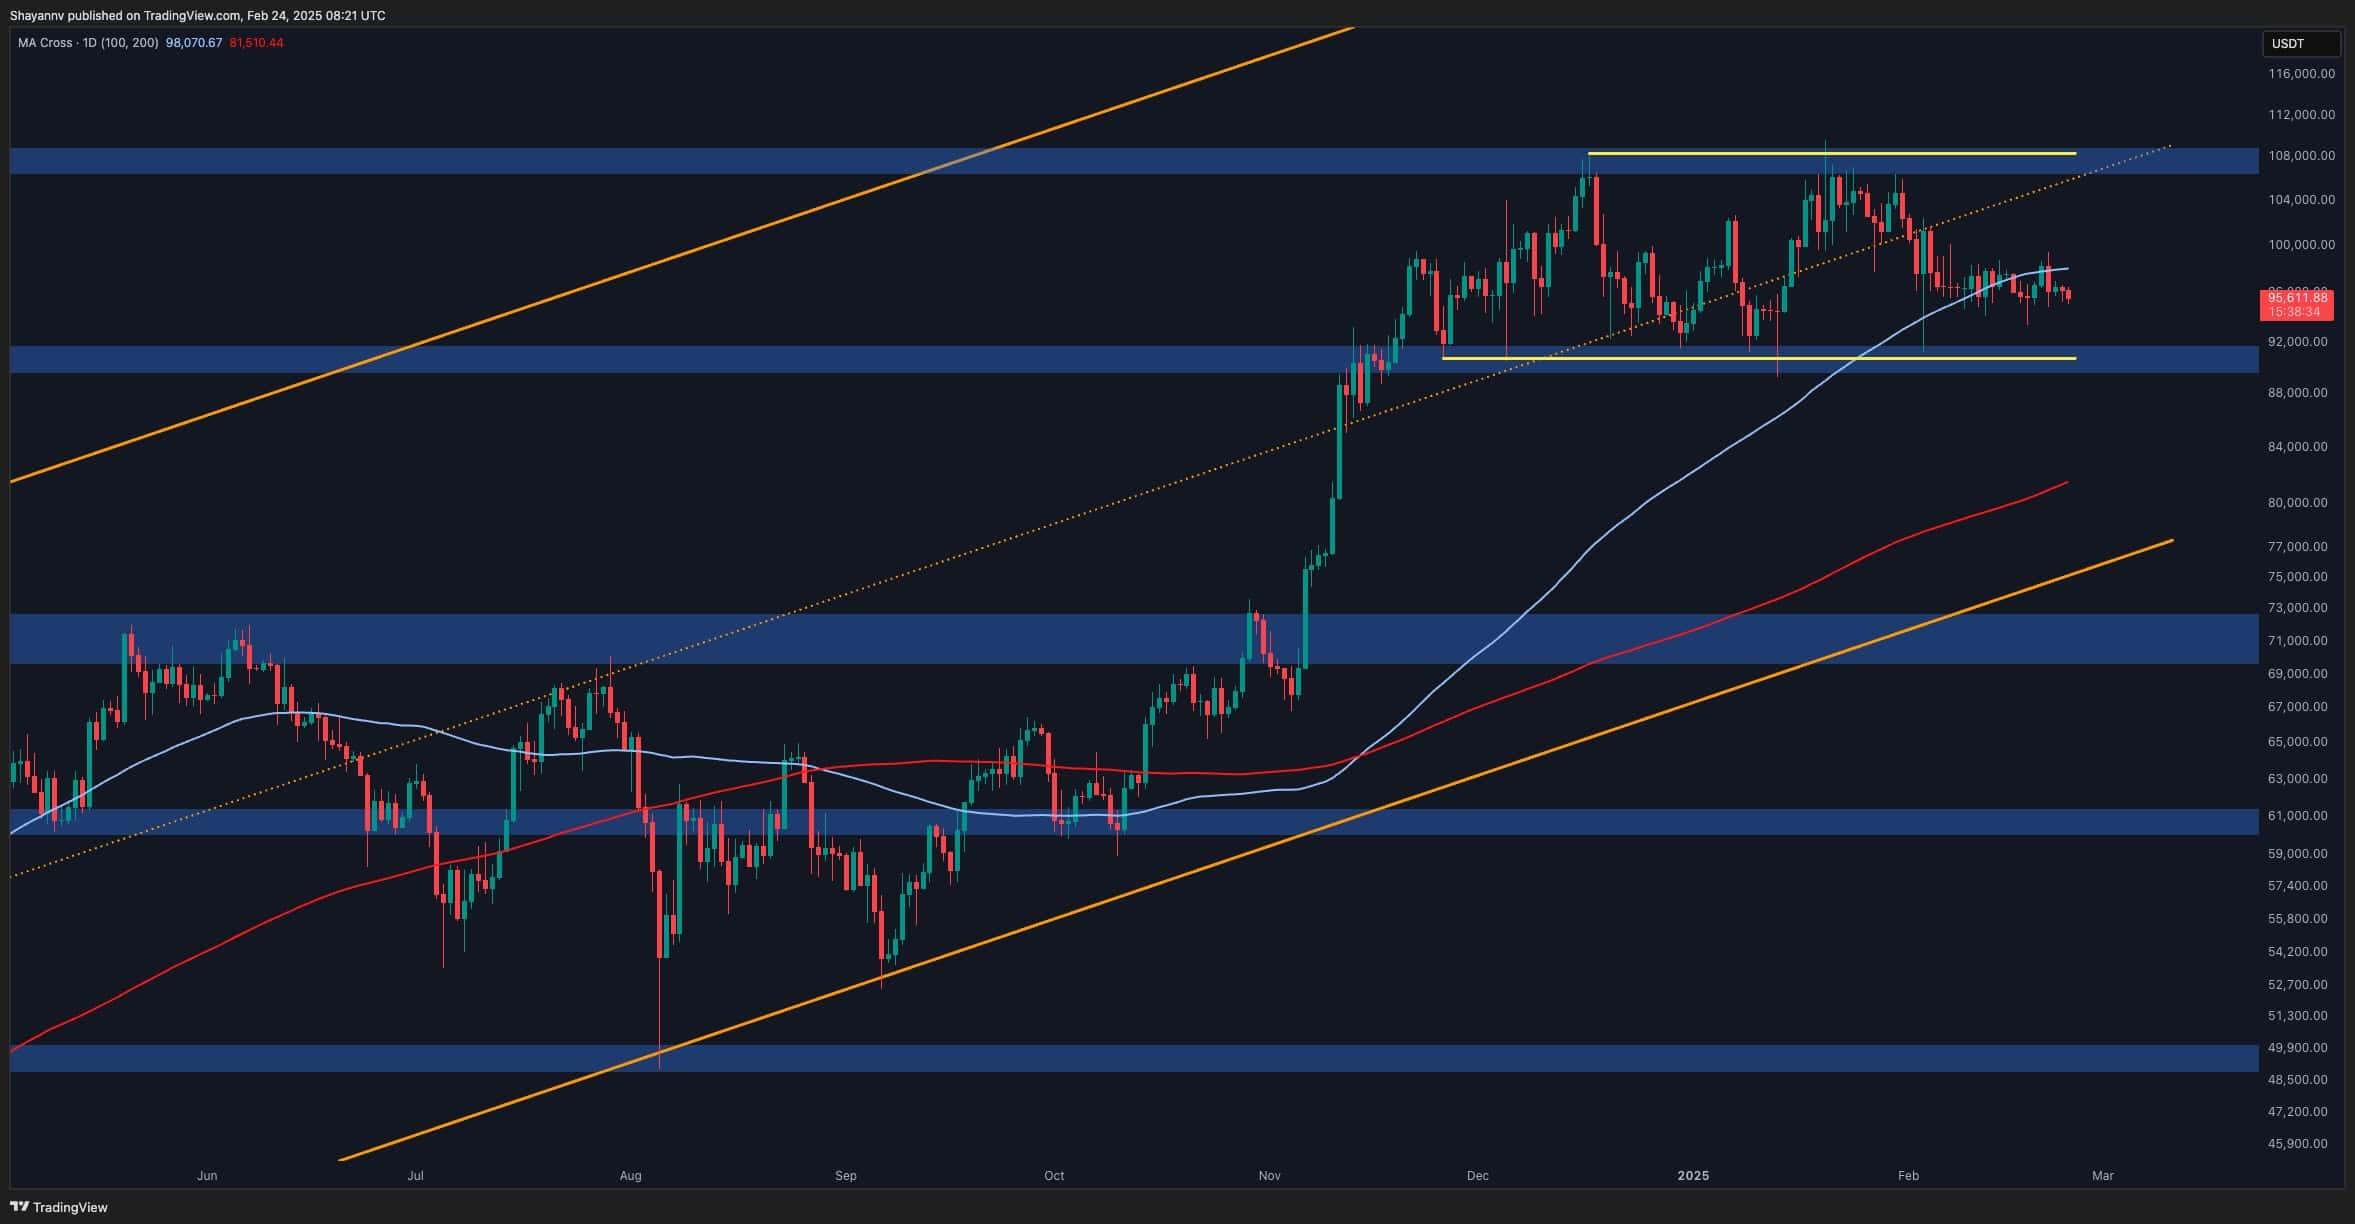
The 4-Hour Chart
On the lower timeframe, Bitcoin’s price action leans bearish, gradually approaching the ascending channel’s lower boundary. The market remains in a state of indecision, with two contrasting scenarios at play.
On the one hand, BTC is nearing a critical support region at the lower boundary of the channel and the $90K range, which has historically acted as a strong demand zone. This could trigger a reversal, leading to renewed bullish momentum.
Conversely, Bitcoin appears to be forming a double-top pattern, with the neckline aligning with the key $90K support zone, also marking previous swing lows. A breakdown below this level could confirm further bearish continuation.
For now, BTC’s price action around $90K will be crucial in determining the next major trend, with further consolidation toward this level expected in the short term.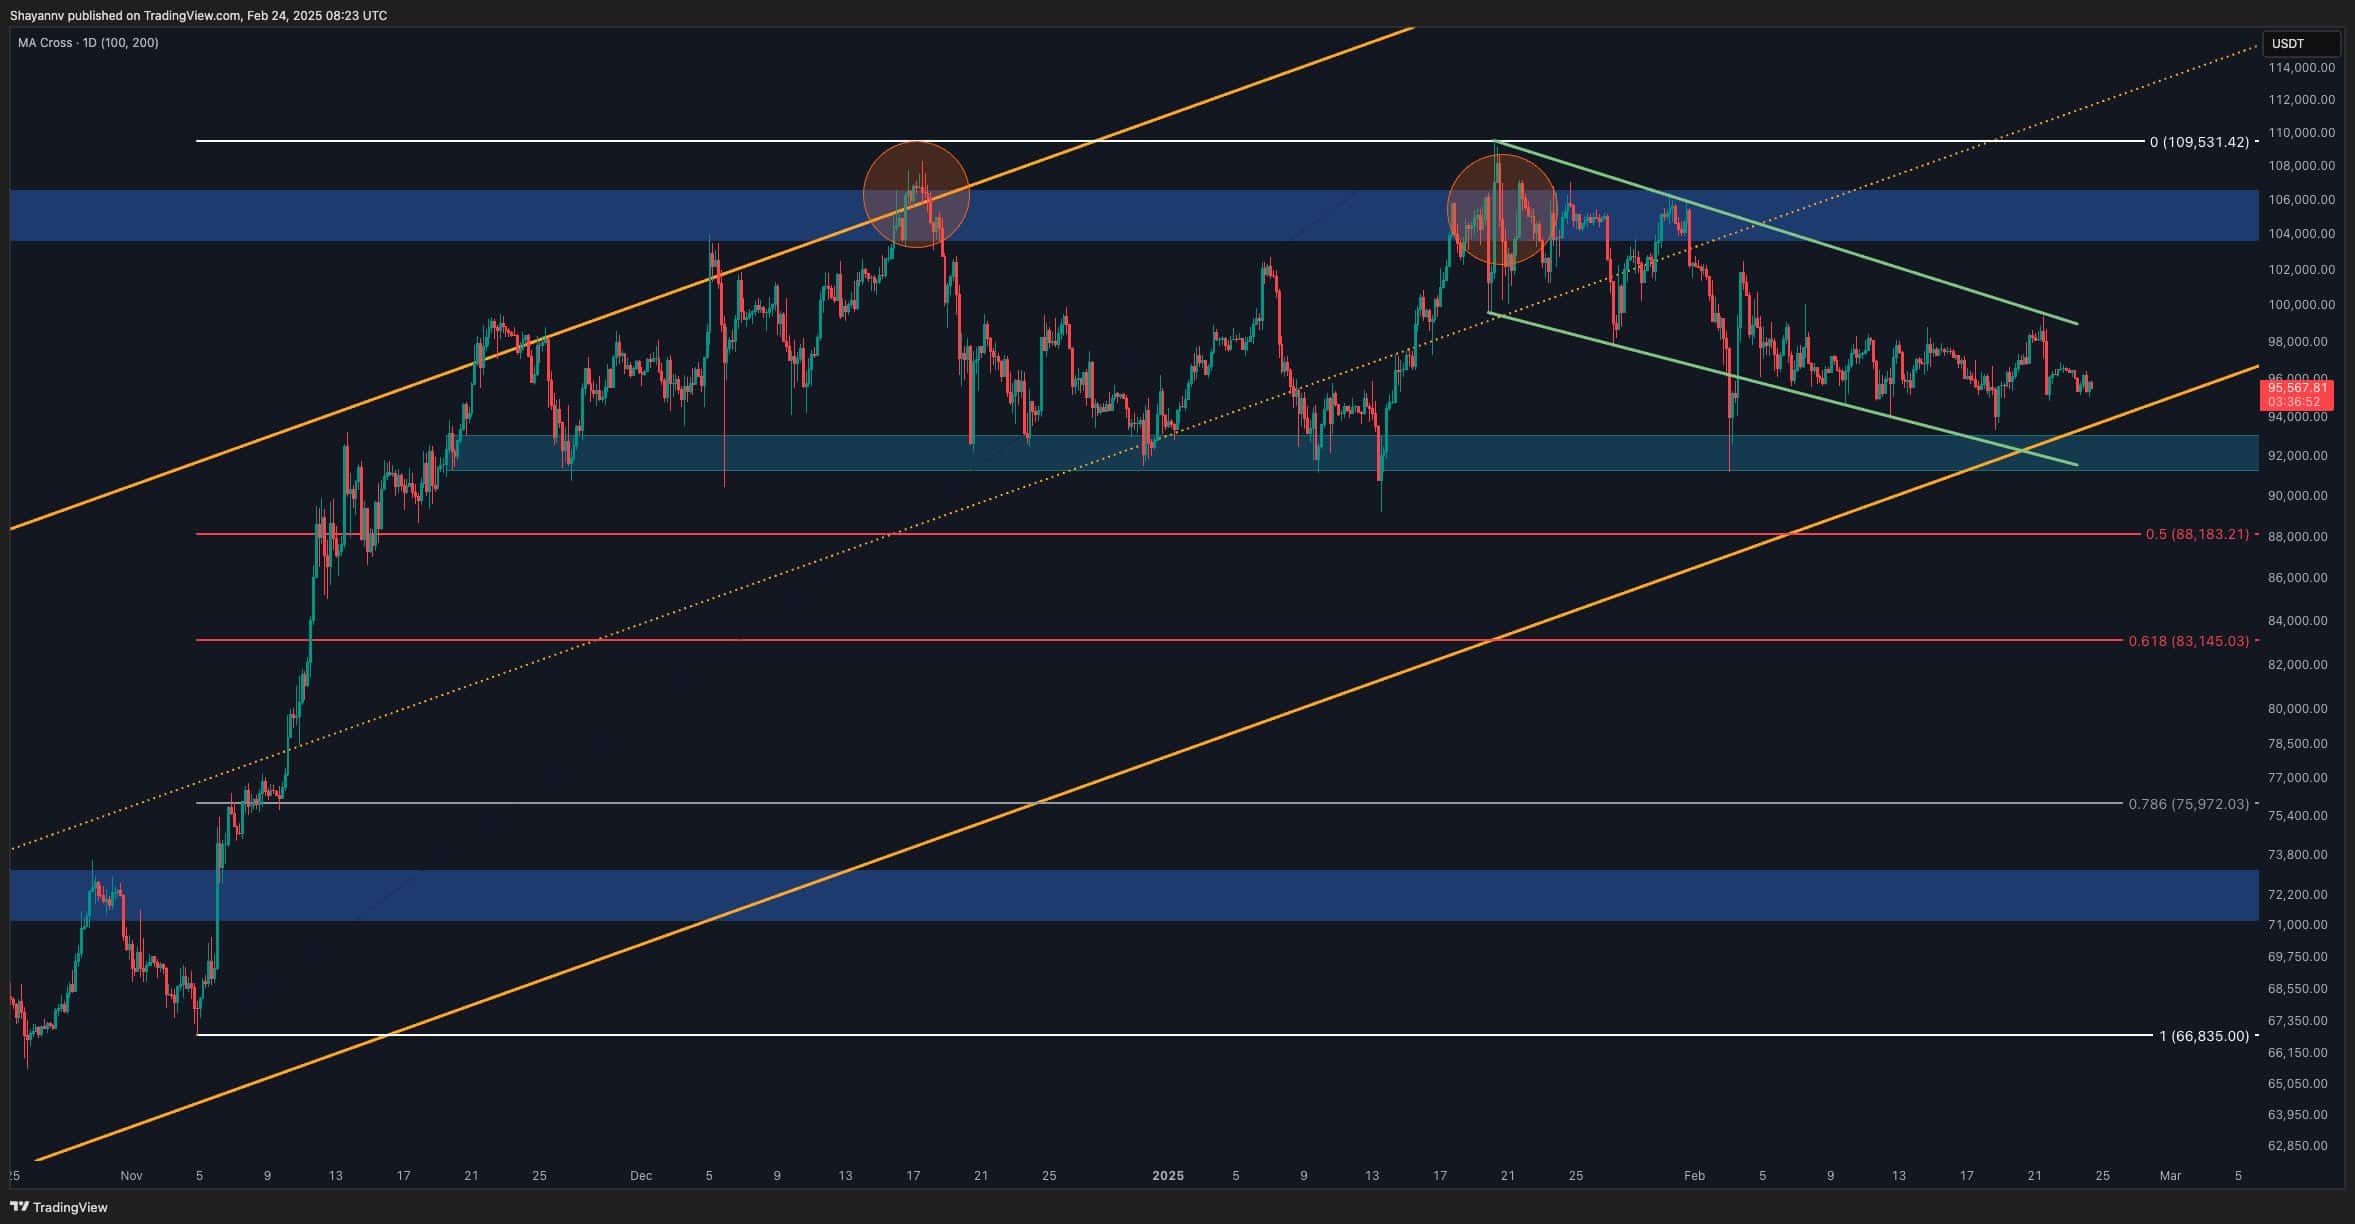
On-chain Analysis
By Shayan
The Bitcoin market is grappling with growing concerns as investor sentiment continues to weaken. The recent rally was fueled by optimism surrounding Trump’s election victory and expectations of strategic asset allocation in the U.S.
However, escalating geopolitical tensions, particularly in trade policies, have triggered risk-off behavior, dampening market momentum. Moving forward, a sustained bullish move will likely require either the resolution of these uncertainties or the emergence of new catalysts.
On-chain data further highlights these concerns. As shown in the chart, the number of active addresses and transactions related to Bitcoin deposits and withdrawals has been notably declining. If this trend continues, it could signal investor exhaustion, similar to the peak market cycles of 2017 and 2021.
Given current conditions, short-term price movements remain difficult to predict. If market sentiment improves and Bitcoin regains upward momentum, investor confidence may strengthen, fueling another rally. However, if uncertainty persists, the market could enter another prolonged consolidation phase, resembling the stagnation seen in early 2024.
Binance Free $600 (CryptoPotato Exclusive): Use this link to register a new account and receive $600 exclusive welcome offer on Binance (full details).
LIMITED OFFER for CryptoPotato readers at Bybit: Use this link to register and open a $500 FREE position on any coin!
Disclaimer: Information found on CryptoPotato is those of writers quoted. It does not represent the opinions of CryptoPotato on whether to buy, sell, or hold any investments. You are advised to conduct your own research before making any investment decisions. Use provided information at your own risk. See Disclaimer for more information.
Cryptocurrency charts by TradingView.


